Health Monitoring
Prometheus metrics
immudb exposes a Prometheus end-point, by default on port 9497 on /metrics.
$ curl -s http://localhost:9497/metrics
# HELP go_gc_duration_seconds A summary of the pause duration of garbage collection cycles.
# TYPE go_gc_duration_seconds summary
go_gc_duration_seconds{quantile="0"} 1.3355e-05
go_gc_duration_seconds{quantile="0.25"} 1.3615e-05
go_gc_duration_seconds{quantile="0.5"} 1.9991e-05
go_gc_duration_seconds{quantile="0.75"} 3.0348e-05
go_gc_duration_seconds{quantile="1"} 3.3859e-05
go_gc_duration_seconds_sum 0.000151623
go_gc_duration_seconds_count 7
# HELP go_goroutines Number of goroutines that currently exist.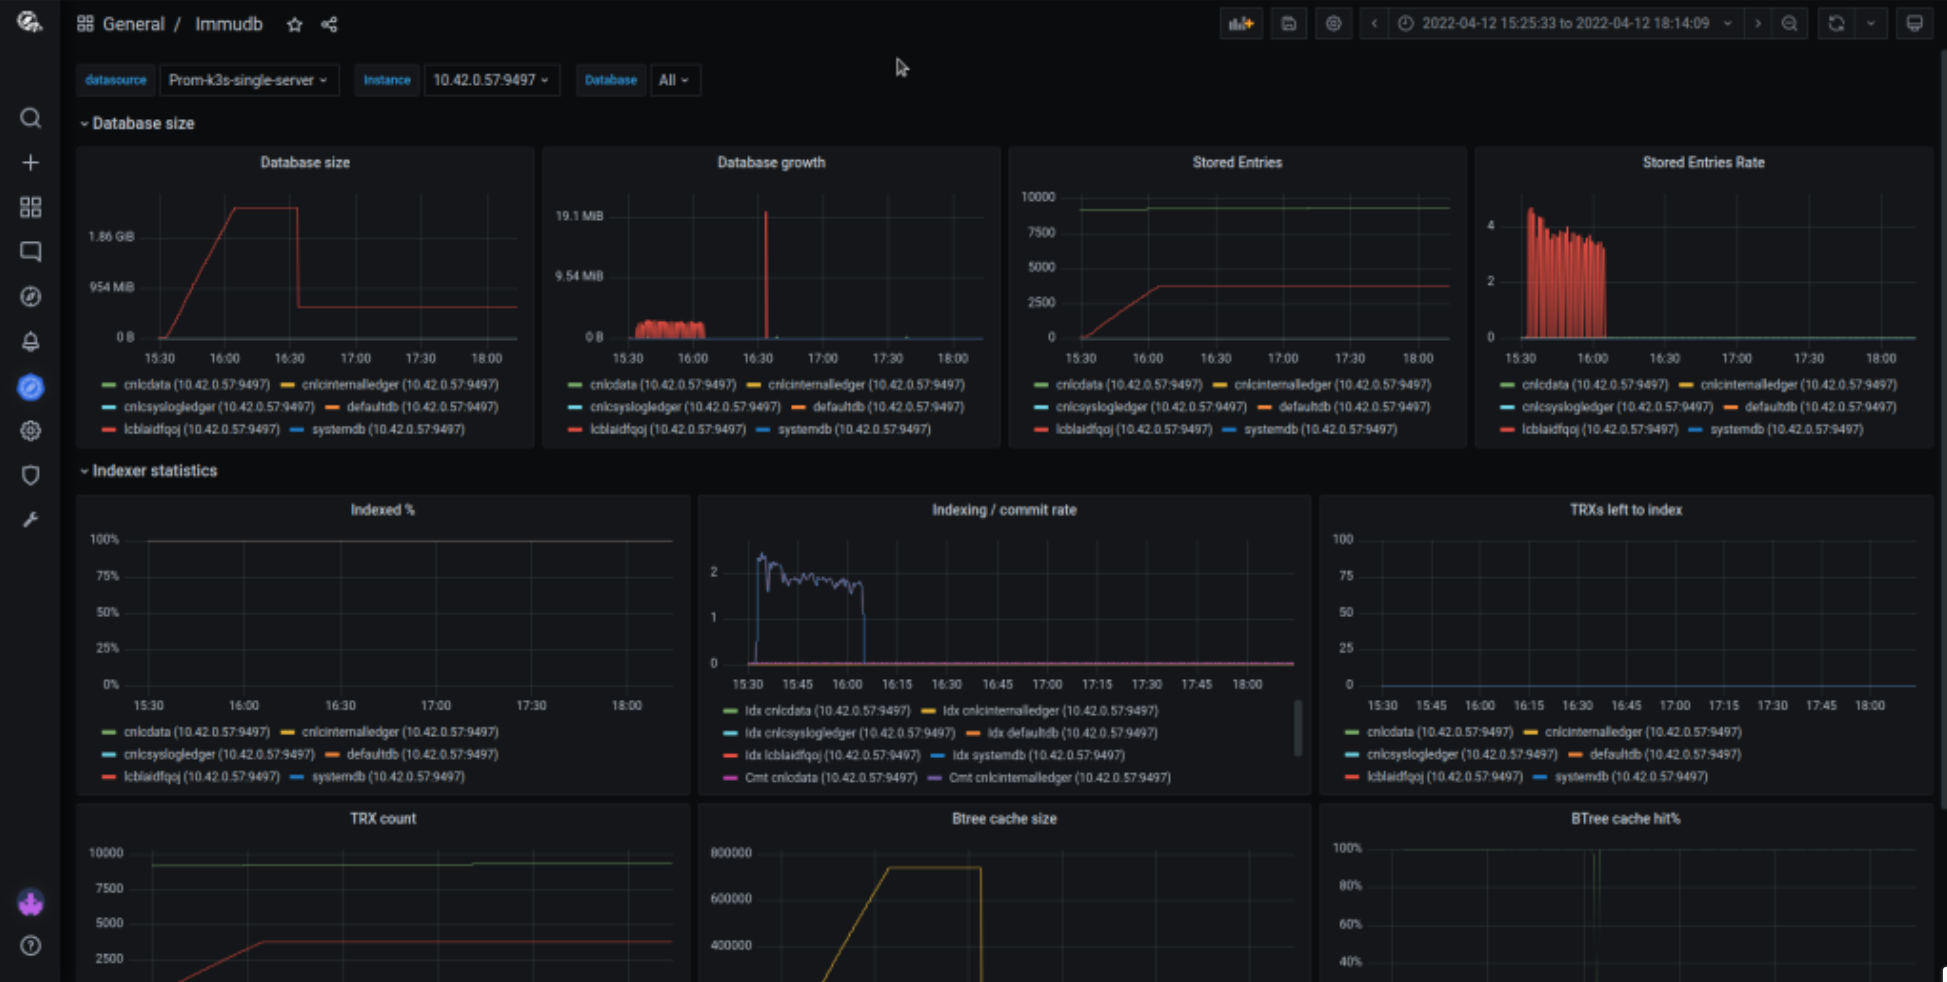
...Querying metrics with a simple curl command is not a very practical solution. immudb has predefined Grafana dashboard visualizing some of the key metrics. This dashboard can be downloaded from immudb github repository.
You can also use immuadmin stats to see these metrics without additional tools:
./immuadmin stats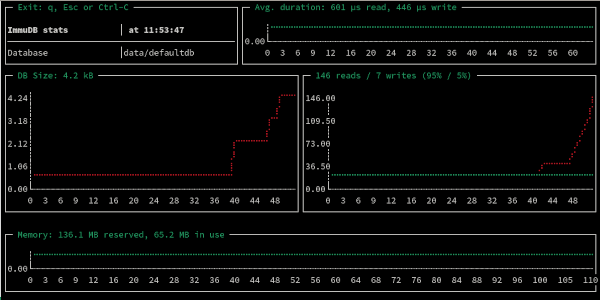
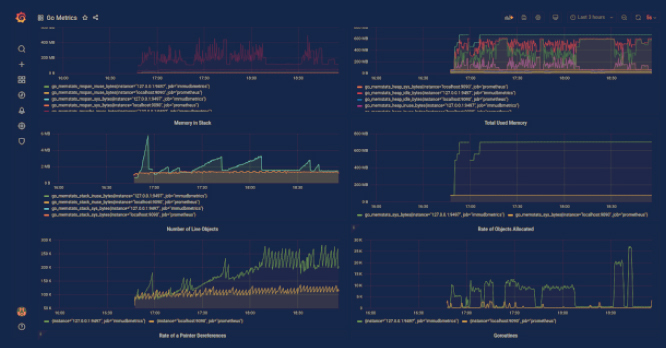
immudb exports the standard Go metrics, so dashboards like Go metrics work out of the box.
For very simple cases, you can use immuadmin status from monitoring scripts to ping the server:
$ ./immuadmin status
OK - server is reachable and responding to queriesDatabase size
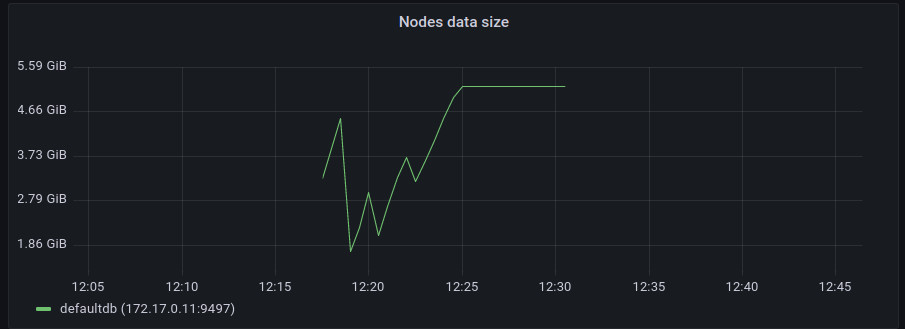
Following metric contains the information about the disk space usage in bytes for each individual database:
$ curl -s localhost:9497/metrics | grep immudb_db_size_bytes
# HELP immudb_db_size_bytes Database size in bytes.
# TYPE immudb_db_size_bytes gauge
immudb_db_size_bytes{db="defaultdb"} 2929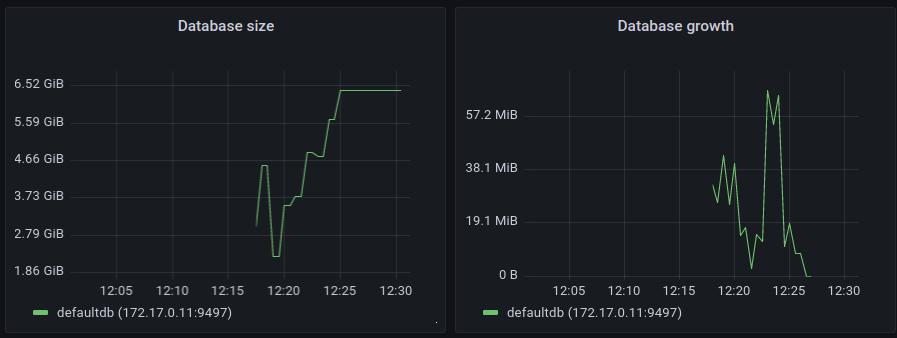
immudb_db_size_bytes{db="systemdb"} 3789The official grafana dashboard is using this metric to show the amount of disk space used by databases and the growth of disk usage over time.
Those dashboards can be used to forecast disk usage and make sure it’s not getting out of control.
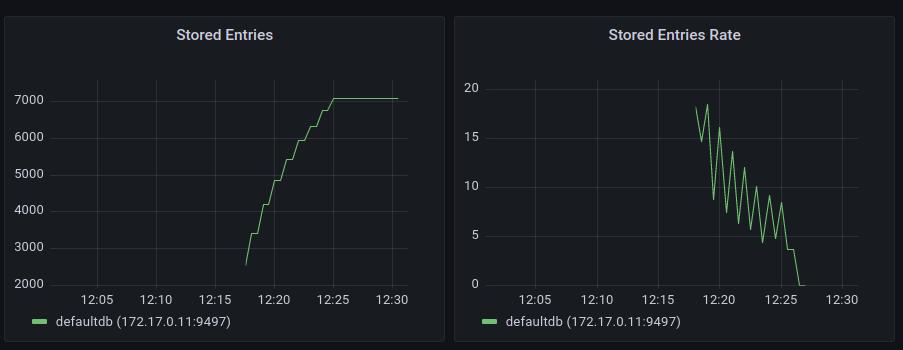
Database entries
Following prometheus metric calculates the number of new KV entries added to the database since the start of the process:
$ curl -s http://localhost:9497/metrics | grep immudb_number_of_stored_entries
# HELP immudb_number_of_stored_entries Number of key-value entries currently stored by the database.
# TYPE immudb_number_of_stored_entries gauge
immudb_number_of_stored_entries{db="defaultdb"} 1
immudb_number_of_stored_entries{db="systemdb"} 2Grafana dashboard show the amount of new DB entries and the insertion rate. This chart does not display the total amount of KV entries and will be reset to zero upon immudb restart.
Indexer metrics
Immudb does expose metrics related to internal indexing process:
$ curl -s http://localhost:9497/metrics | grep 'immudb_last_.*_trx_id'
# HELP immudb_last_committed_trx_id The highest id of committed transaction
# TYPE immudb_last_committed_trx_id gauge
immudb_last_committed_trx_id{db="defaultdb"} 1
immudb_last_committed_trx_id{db="systemdb"} 2
# HELP immudb_last_indexed_trx_id The highest id of indexed transaction
# TYPE immudb_last_indexed_trx_id gauge
immudb_last_indexed_trx_id{db="defaultdb"} 1
immudb_last_indexed_trx_id{db="systemdb"} 2Those metrics are used on various graphs on the Grafana dashboard.
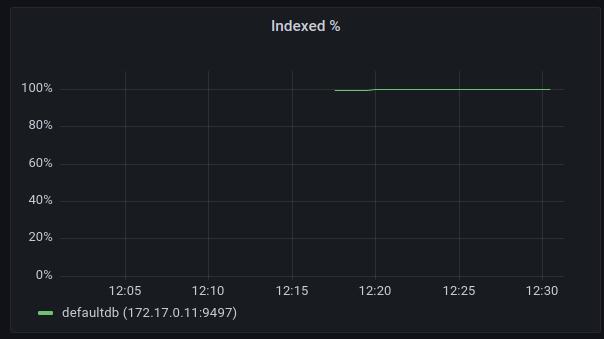
Indexed %
This graph shows the total percentage of all transactions in the database that has been indexed so far. In a healthy situation, this chart should remain at or close to 100%. If this value starts dropping down, that means that the data ingestion rate is higher than the indexing rate indicating that additional rate limiting should be added to db writers.
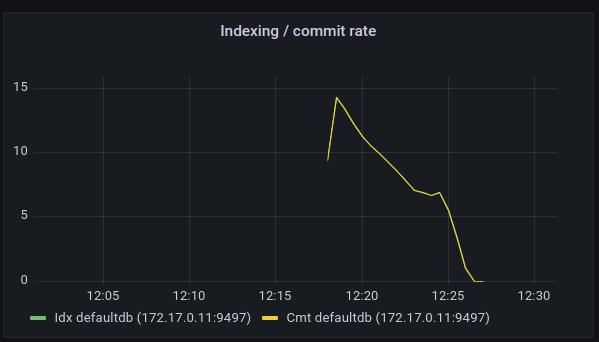
Indexing / Commit rate
This chart shows the rate of new transactions added to the database and the rate of indexing those transactions. If the indexing rate is smaller than the commit rate, this means that the database isn’t keeping up with the indexing. In applications where only synchronous writes are performed or where data can be immediately indexed, the indexing rate line (Idx) and commit rate line (Cmt) will overlap.
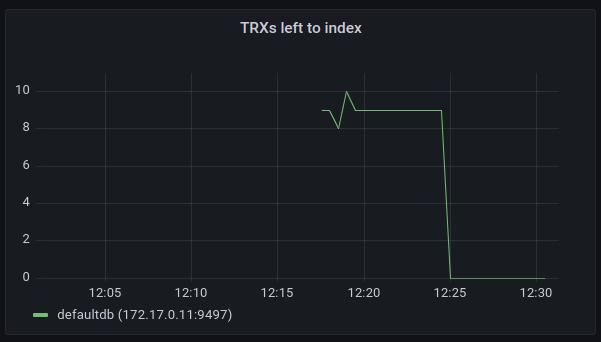
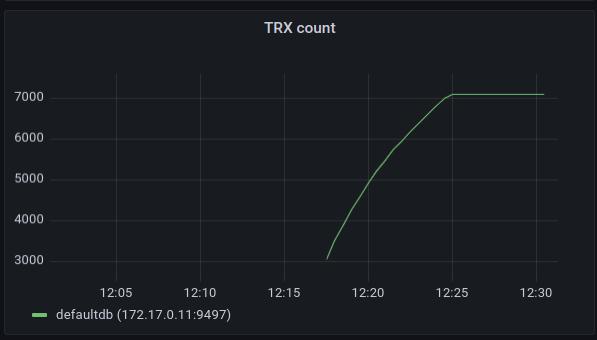
TRXs Left to Index
This chart shows the number of transactions waiting for indexing. This value should be close to zero and should have a decreasing tendency.
Btree metrics
immudb exposes various metrics per btree instance. The id label is a relative path for the location of the btree on disk. Currently there's a single btree instance per one database.
$ curl -s http://localhost:9497/metrics | grep 'immudb_btree_'
# HELP immudb_btree_depth Btree depth
# TYPE immudb_btree_depth gauge
immudb_btree_depth{id="data/defaultdb/index"} 1
immudb_btree_depth{id="data/systemdb/index"} 1
# HELP immudb_btree_flushed_entries_last_cycle Numbers of btree entries written to disk during the last flush process
# TYPE immudb_btree_flushed_entries_last_cycle gauge
immudb_btree_flushed_entries_last_cycle{id="data/defaultdb/index"} 1
immudb_btree_flushed_entries_last_cycle{id="data/systemdb/index"} 2
# HELP immudb_btree_flushed_entries_total Number of btree entries written to disk during flush since the immudb process was started
# TYPE immudb_btree_flushed_entries_total counter
immudb_btree_flushed_entries_total{id="data/defaultdb/index"} 1
immudb_btree_flushed_entries_total{id="data/systemdb/index"} 3
# HELP immudb_btree_flushed_nodes_last_cycle Numbers of btree nodes written to disk during the last flush process
# TYPE immudb_btree_flushed_nodes_last_cycle gauge
immudb_btree_flushed_nodes_last_cycle{id="data/defaultdb/index",kind="inner"} 0
immudb_btree_flushed_nodes_last_cycle{id="data/defaultdb/index",kind="leaf"} 1
immudb_btree_flushed_nodes_last_cycle{id="data/systemdb/index",kind="inner"} 0
immudb_btree_flushed_nodes_last_cycle{id="data/systemdb/index",kind="leaf"} 1
# HELP immudb_btree_flushed_nodes_total Number of btree nodes written to disk during flush since the immudb process was started
# TYPE immudb_btree_flushed_nodes_total counter
immudb_btree_flushed_nodes_total{id="data/defaultdb/index",kind="inner"} 0
immudb_btree_flushed_nodes_total{id="data/defaultdb/index",kind="leaf"} 2
immudb_btree_flushed_nodes_total{id="data/systemdb/index",kind="inner"} 0
immudb_btree_flushed_nodes_total{id="data/systemdb/index",kind="leaf"} 3
# HELP immudb_btree_leaf_node_entries Histogram of number of entries in as single leaf btree node, calculated when visiting btree nodes
# TYPE immudb_btree_leaf_node_entries histogram
immudb_btree_leaf_node_entries_bucket{id="data/defaultdb/index",le="1"} 7
immudb_btree_leaf_node_entries_bucket{id="data/defaultdb/index",le="2"} 7
....
immudb_btree_leaf_node_entries_sum{id="data/defaultdb/index"} 4
immudb_btree_leaf_node_entries_count{id="data/defaultdb/index"} 7
immudb_btree_leaf_node_entries_bucket{id="data/systemdb/index",le="1"} 8
immudb_btree_leaf_node_entries_bucket{id="data/systemdb/index",le="2"} 11
....
immudb_btree_leaf_node_entries_sum{id="data/systemdb/index"} 11
immudb_btree_leaf_node_entries_count{id="data/systemdb/index"} 11
# HELP immudb_btree_nodes_data_begin Beginning offset for btree nodes data file
# TYPE immudb_btree_nodes_data_begin gauge
immudb_btree_nodes_data_begin{id="data/defaultdb/index"} 0
immudb_btree_nodes_data_begin{id="data/systemdb/index"} 0
# HELP immudb_btree_nodes_data_end End offset for btree nodes data appendable
# TYPE immudb_btree_nodes_data_end gauge
immudb_btree_nodes_data_end{id="data/defaultdb/index"} 100
immudb_btree_nodes_data_end{id="data/systemdb/index"} 281Grafana dashboard exposes both some basic and more advanced btree statistics.
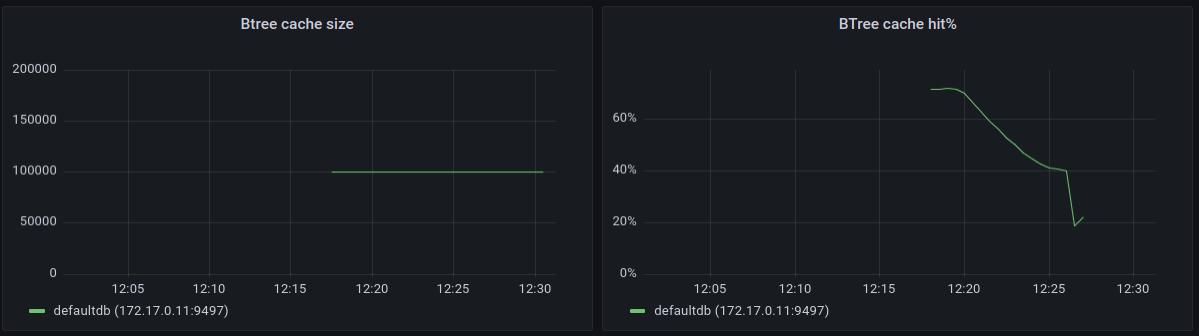
Btree Cache Size / Btree Cache Hit %
Those two charts show internal statistics about immudb btree cache. In order to avoid reading large amounts of data on every btree operation, immudb keeps an in-memory cache of recently used btree nodes. The amount of nodes in the cache is shown in the first chart, it is capped at the maximum amount of cache entries.
The second chart shows how effective the cache is presenting the percentage of btree node lookups that were optimized with the cache. For small databases, it’s very likely that this hit ratio will be close to 100%, but it will drop down once the amount of data increases. There’s no single rule on what value we should expect here. In our internal tests even 40% cache hit ratios with workloads using keys with random distribution were still yielding very good performance results. To get higher cache utilization, applications should prefer working on keys close to themselves - such as using sequentially increasing numbers where newly inserted data will end up in the btree portion close to previously accessed entries.
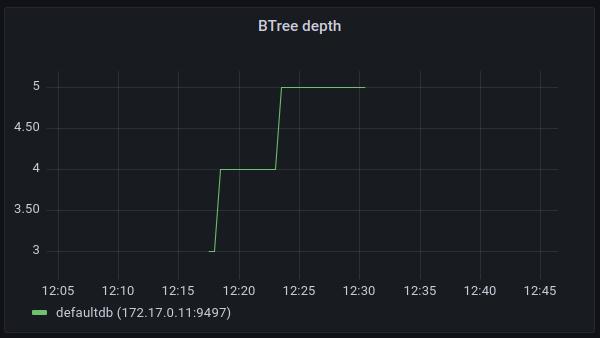
Btree Depth
This chart shows the depth of the tree. Since btrees are auto-balancing data structures, this depth will have a logarithmic tendency. The depth of the tree indicates what is the amount of nodes traversed by each btree operation.
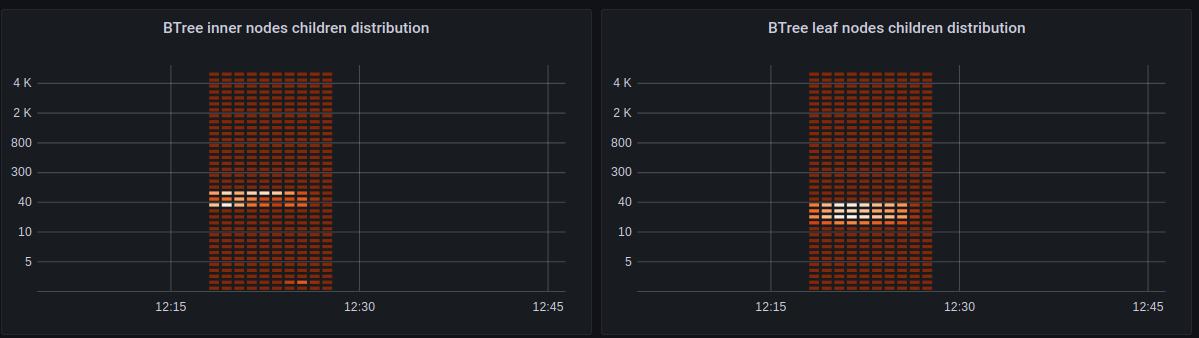
Btree Child Node Count Distributions
These graphs show the distribution of the amount of child nodes. In a healthy btree like the one below, the amount of child nodes should be focused around a single value (40 in the example). Also the amount of child nodes should be kept at sane levels - values below 10 or above few hundred are a good indication that the btree isn’t performing well and the application should consider using keys of different, more uniform and shorter lengths for its data.
Note: These statistics are gathered when traversing the btree, if there’s no activity in the database the distribution will be flat.
Flush Statistics
immudb keeps recent btree changes in memory to reduce the amount of data to be written to disk. In order to persist those changes, there’s a btree flush process called once a threshold of new and modified entries is reached.
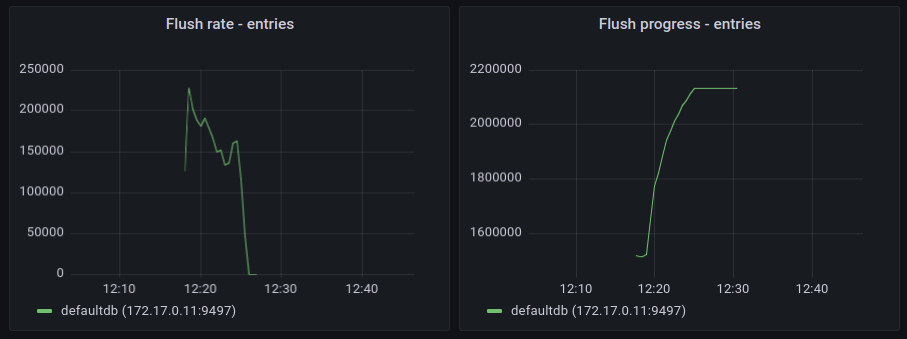
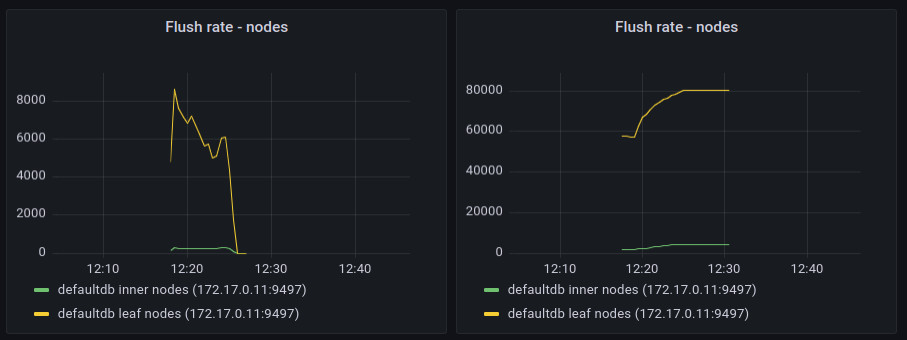
These metrics are calculated for nodes (both inner and leaf ones) and separately for KV entries in the leaf nodes.
The flush rate shows the rate of written nodes / entries per second. It clearly shows where the flush process started and where it ended.
Flush progress metrics for each flush cycle starts at zero and reach the total amount of entries processed during such single flush operation. The next flush will repeat the process by starting from zero reaching the maximum value. By looking at those maximum values, we can see how much data needs to be written to disk during flush operations. During normal DB operation, it should be steady over time. An unbound growth of those maximums could indicate that the flush operation is too aggressive and the threshold should be adjusted.
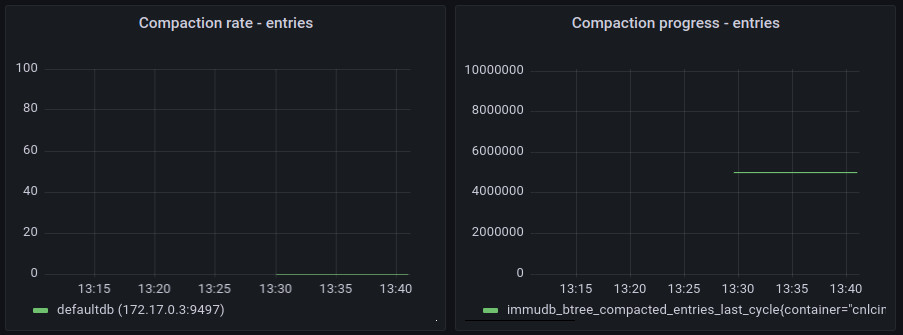
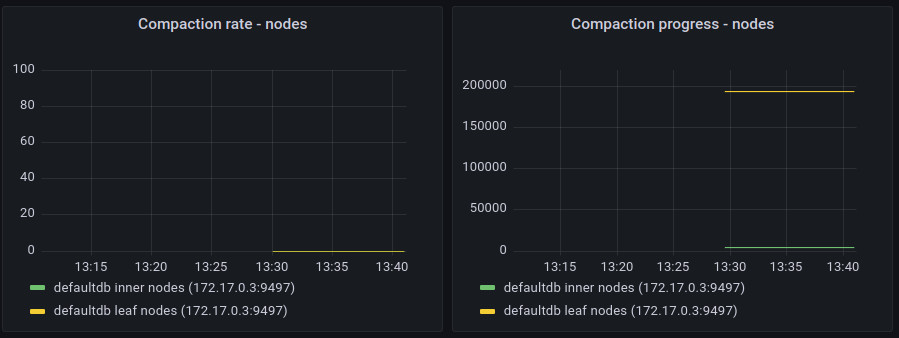
Compaction Statistics
Similarly to flush statistics, immudb exposes the same set of values for full compaction.
Note: these values are gathered for overall compaction that fully rewrites the btree structure. immudb 1.2.3 introduced a new online compaction mode that gradually removes unused btree data during flush operation. This new compaction mode is not included in those charts.
Data Size for Btree Nodes
immudb internally uses append-only files to store data. That is also used for btree nodes. We don’t replace existing data on disk. Instead we append a new modified version at the end of the data stream. immudb 1.2.3 introduced new online compaction of btree data that deals with garbage that naturally accumulates at the beginning of such data stream over time. This chart can be used to ensure that the amount of data being used for btree nodes is being reduced whenever a cleanup operation is performed.
S3 storage metrics
Various metrics are exposed when working with remote storage such as S3. Those can be used to help analyzing s3 performance and resource consumption.
$ curl -s http://localhost:9497/metrics | grep 'remote'
# HELP immudb_remoteapp_chunk_bytes Total number of bytes stored in chunks
# TYPE immudb_remoteapp_chunk_bytes gauge
....
immudb_remoteapp_chunk_bytes{path="defaultdb/aht/tree/",state="Active"} 133631
immudb_remoteapp_chunk_bytes{path="defaultdb/aht/tree/",state="Cleaning"} 0
immudb_remoteapp_chunk_bytes{path="defaultdb/aht/tree/",state="DownloadError"} 0
immudb_remoteapp_chunk_bytes{path="defaultdb/aht/tree/",state="Downloading"} 0
immudb_remoteapp_chunk_bytes{path="defaultdb/aht/tree/",state="Invalid"} 0
immudb_remoteapp_chunk_bytes{path="defaultdb/aht/tree/",state="Local"} 0
immudb_remoteapp_chunk_bytes{path="defaultdb/aht/tree/",state="Remote"} 1.048767e+06
immudb_remoteapp_chunk_bytes{path="defaultdb/aht/tree/",state="UploadError"} 0
immudb_remoteapp_chunk_bytes{path="defaultdb/aht/tree/",state="Uploading"} 0
...
# HELP immudb_remoteapp_chunk_count Number of chunks used for immudb remote storage
# TYPE immudb_remoteapp_chunk_count gauge
....
immudb_remoteapp_chunk_count{path="defaultdb/aht/tree/",state="Active"} 1
immudb_remoteapp_chunk_count{path="defaultdb/aht/tree/",state="Cleaning"} 0
immudb_remoteapp_chunk_count{path="defaultdb/aht/tree/",state="DownloadError"} 0
immudb_remoteapp_chunk_count{path="defaultdb/aht/tree/",state="Downloading"} 0
immudb_remoteapp_chunk_count{path="defaultdb/aht/tree/",state="Invalid"} 0
immudb_remoteapp_chunk_count{path="defaultdb/aht/tree/",state="Local"} 0
immudb_remoteapp_chunk_count{path="defaultdb/aht/tree/",state="Remote"} 1
....
# HELP immudb_remoteapp_corrupted_metadata Number of corrupted metadata detections in an immudb remote storage
# TYPE immudb_remoteapp_corrupted_metadata counter
immudb_remoteapp_corrupted_metadata 0
# HELP immudb_remoteapp_download_events Immudb remote storage download event counters
# TYPE immudb_remoteapp_download_events counter
immudb_remoteapp_download_events{event="cancelled"} 0
immudb_remoteapp_download_events{event="failed"} 0
immudb_remoteapp_download_events{event="finished"} 0
immudb_remoteapp_download_events{event="retried"} 0
immudb_remoteapp_download_events{event="started"} 0
immudb_remoteapp_download_events{event="succeeded"} 0
# HELP immudb_remoteapp_open_time Histogram of the total time required to open a chunk of data stored on an immudb remote storage
# TYPE immudb_remoteapp_open_time histogram
immudb_remoteapp_open_time_bucket{le="0.1"} 0
immudb_remoteapp_open_time_bucket{le="0.25"} 0
....
immudb_remoteapp_open_time_sum 0.747774699
immudb_remoteapp_open_time_count 2
# HELP immudb_remoteapp_read_bytes Total number of bytes read from immudb remote storage (including cached reads)
# TYPE immudb_remoteapp_read_bytes counter
immudb_remoteapp_read_bytes 0
# HELP immudb_remoteapp_read_events Read event counters for immudb remote storage
# TYPE immudb_remoteapp_read_events counter
immudb_remoteapp_read_events{event="errors"} 0
immudb_remoteapp_read_events{event="total_reads"} 0
# HELP immudb_remoteapp_s3_download_bytes Number data bytes (excluding headers) downloaded from s3
# TYPE immudb_remoteapp_s3_download_bytes counter
immudb_remoteapp_s3_download_bytes 2.097657e+06
# HELP immudb_remoteapp_s3_upload_bytes Number data bytes (excluding headers) uploaded to s3
# TYPE immudb_remoteapp_s3_upload_bytes counter
immudb_remoteapp_s3_upload_bytes 2.097657e+06
# HELP immudb_remoteapp_uncached_read_bytes Direct (uncached) read byte counters for immudb remote storage
# TYPE immudb_remoteapp_uncached_read_bytes counter
immudb_remoteapp_uncached_read_bytes 2.097645e+06
# HELP immudb_remoteapp_uncached_read_events Direct (uncached) read event counters for immudb remote storage
# TYPE immudb_remoteapp_uncached_read_events counter
immudb_remoteapp_uncached_read_events{event="errors"} 0
immudb_remoteapp_uncached_read_events{event="total_reads"} 2
# HELP immudb_remoteapp_upload_events Immudb remote storage upload event counters
# TYPE immudb_remoteapp_upload_events counter
immudb_remoteapp_upload_events{event="cancelled"} 0
immudb_remoteapp_upload_events{event="failed"} 0
immudb_remoteapp_upload_events{event="finished"} 2
immudb_remoteapp_upload_events{event="retried"} 0
immudb_remoteapp_upload_events{event="started"} 2
immudb_remoteapp_upload_events{event="succeeded"} 2
# HELP immudb_remoteapp_upload_time Histogram of the total time required to upload a chunk to the remote storage
# TYPE immudb_remoteapp_upload_time histogram
immudb_remoteapp_upload_time_bucket{le="0.1"} 0
immudb_remoteapp_upload_time_bucket{le="0.25"} 1
....
immudb_remoteapp_upload_time_sum 0.983413478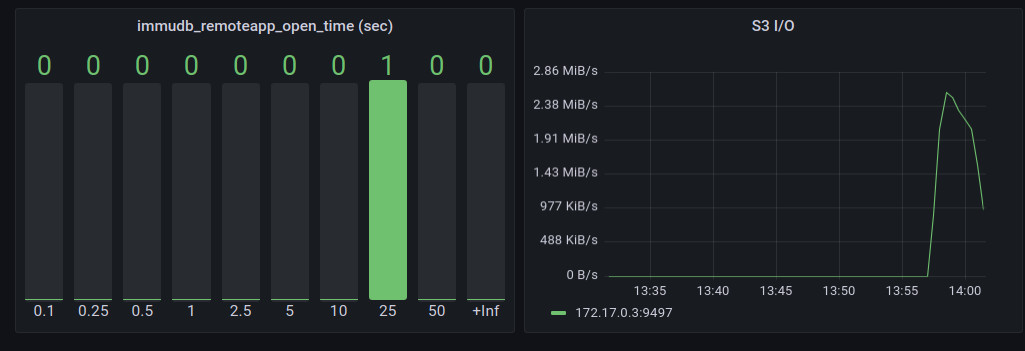
immudb_remoteapp_upload_time_count 2The section related to S3 in the Grafana dashboard is in its early days but already shows some basic insights into what the data performance is using immudb with an AWS S3 backed data store. The first chart shows the histogram of a single s3 object read duration, the second one shows the inbound traffic needed for immudb operations. If those values are high, you should consider switching back to local disk and an alternative remote storage back-end such as EBS volumes.
immuguard health check tool
To help you check global immudb health, and reliably deploy immudb in production environment, you can use immuguard, the health check tool you can find in the immudb-tools repository.
This simple tool periodically polls immudb, checking the state of every loaded database, and exposes a simple REST endpoint that can be used by docker or kubernetes probes. You simply have to configure it to talk to immudb, by providing its address and some credentials.
Then you can poll endpoint /immustatus on port 8085. If immudb is operating normally and all databases are responsive, you will get a 200 HTTP return code, and the string "OK". You will get a 500 HTTP code instead, and the string "FAIL" if immudb is not responding.
This configuration snippet shows how to use the /immustatus endpoint on kubernetes:
livenessProbe:
  httpGet:
    path: /immustatus
    port: 8085
  failureThreshold: 5
periodSeconds: 60You can find more information about it on its README page.