Health Monitoring
immudb exposes a Prometheus end-point, by default on port 9497 on /metrics.
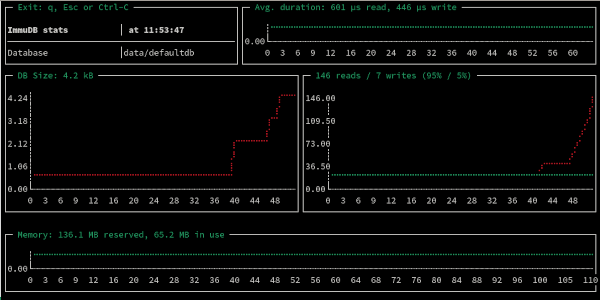
You can use immuadmin stats to see these metrics without additional tools:

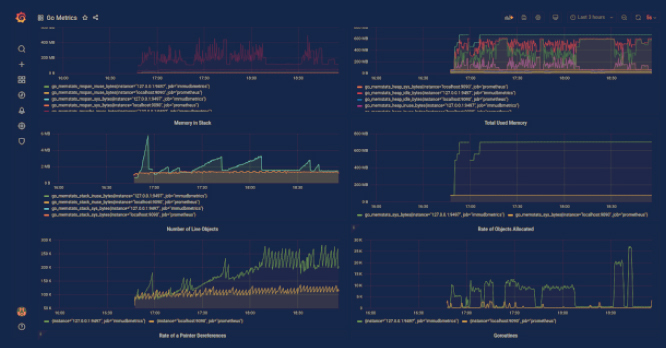
immudb exports the standard Go metrics, so dashboards like Go metrics work out of the box.

For very simple cases, you can use immuadmin status from monitoring scripts to ping the server:
$ immuadmin status
OK - server is reachable and responding to queries